Upcoming Max Transit Changes
Max Transit has recently released their plans for upcoming changes to Birmingham, AL’s transit system that will go into effect in mid to late May. The plan primarily consists of two parts:
- Using the new BRT (Bus Rapid Transit) stations as hubs to begin moving away from the central hub and spoke model that has been out of date for decades.
- Using “On-Demand” service for areas of low ridership.
Why is this happening?
There appears to be three major reasons for these changes.
First, Birmingham’s transit system has used a hub and spoke model for 60+ years. The original assumption was that every one from the edges of Birmingham would all want to come to Central Station. With changes in population, this is no longer an accurate representation of how riders want to utilize public transportation.
Several other hub and spoke transportation systems in other cities in the US have already or are planning to reconfigure their system into a grid like system. A grid system has several advantages, including higher frequency, multiple paths to your destination, and better coverage. However, it comes with a potential downside of needing to transfer rather than having a direct route. Transferring is really only an issue if the frequency of buses is poor.
With the completion of the East-West BRT (Bus Rapid Transit) system last year, Birmingham now has several stations or hubs that can be utilized. This is allowing Max to begin to reconfigure their system into a more grid like system and utilize the BRT as the backbone of the system.
In my opinion, this is the correct direction to be heading in, and I am excited about realignments that focus on connecting with the BRT.
Second, as seems to always be the case in Birmingham, Max is severely underfunded. This means trying to use what little resources they have as efficiently as possible. Unfortunately, this means removing duplication and eliminating areas of low usage, so you can allocate more resources to areas of high demand.
Third, there is a nation wide shortage of bus operators, mechanics, and other related workers. During the meeting, Director Charlotte Shaw said that there is a 80k-100k shortage of public transit workers nationally. At Max, there is currently a lack of bus operators. Max has 30% fewer operators than they need to operate the system! This means drivers are working overtime and/or trips on routes have to be canceled daily. In fact, if you subscribe to Max’s alert system, you will get messages like those below throughout the day of trips being canceled, likely because of a lack of operators.
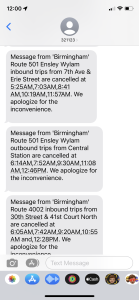
Bus operators must have a CDL (commercial drivers license), and finding operators to hire has been difficult for Max since COVID.
One advantage of the On Demand service, is that the vehicle is a standard Minivan and does not require a CDL, which means it is easier to find operators.
Route Realignments
First, let’s look at routes that are being modified to use the BRT stations as hubs:
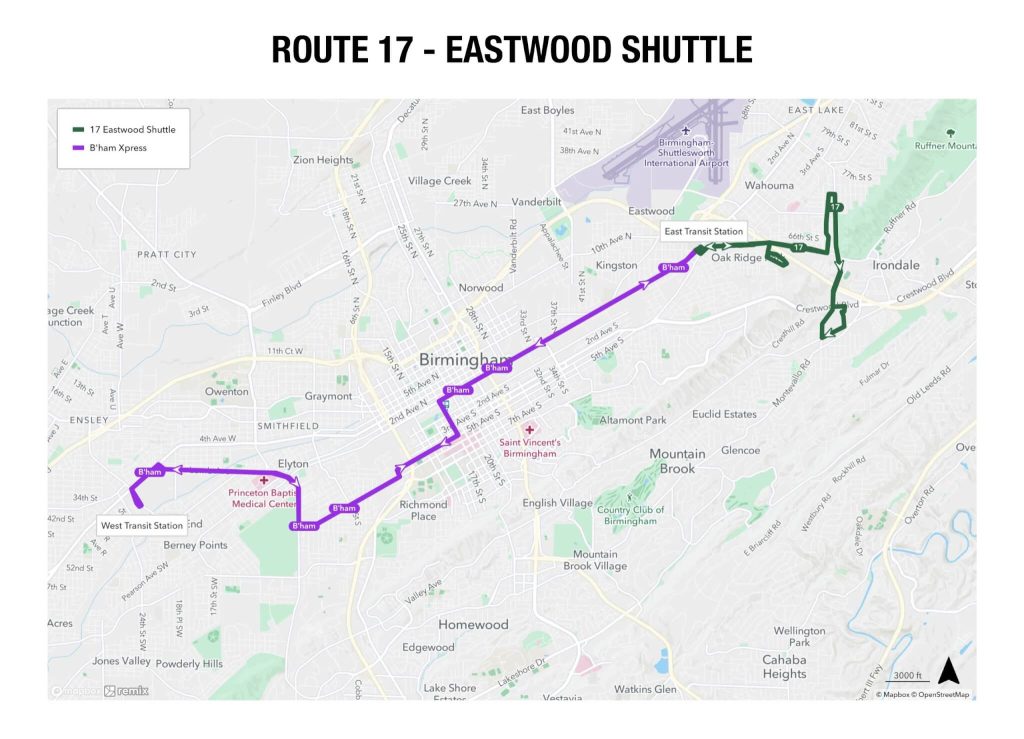
17 – Eastwood
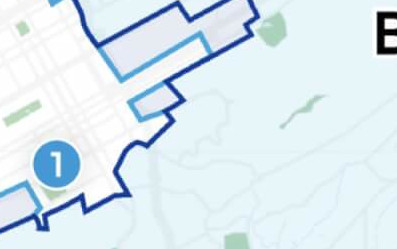
This is a map of the current route 17 (Green) and the BRT (Purple). Currently, the 17 meets up with the BRT at the east Woodlawn station, but continues to central station downtown on the 3rd/4th Ave S/US 78 corridor.
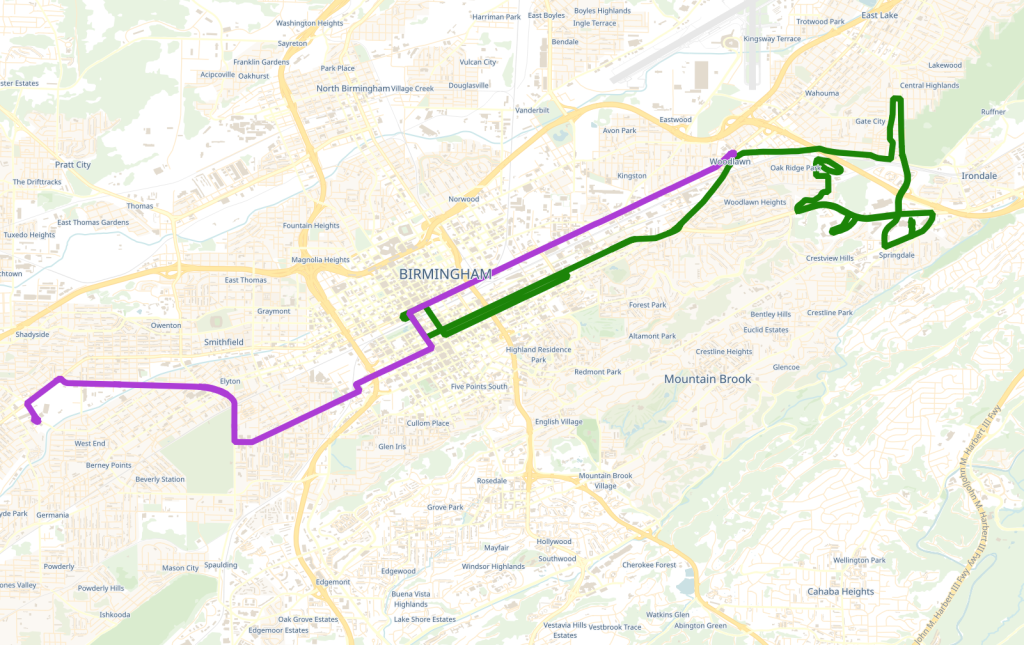
The upcoming changes have the 17 terminating at the BRT east Woodlawn station. Riders that want to continue downtown must now transfer to the BRT.
The Route 17 is significantly shorter and eliminates duplication. Based upon the proposed timetable, it is a 35 minute loop with a 10 minute buffer at the Woodlawn transit center. This allows the transit agency to run a single bus and have 45 minute frequency, whereas previously, frequency was at best 55 minutes. With the updated route, the bus will run the route 21 times vs currently only running 19 times.
Riders will have to transfer to the BRT, and depending upon that transfer time, the time to central station should be roughly equal, as the BRT is an express bus, rather than a local.
The biggest effect is that the 17 no longer provides service down US 78 (3rd/4th Av S). To compensate for this, the 25 will be realigned to no longer duplicate the BRT down 1st Av N, but instead take US 78.
Route 25 – Center Point
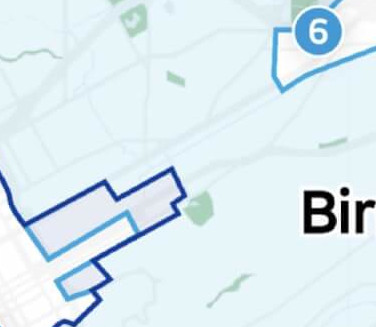
This is a map of the current route 25 (Red) and the BRT (Purple).
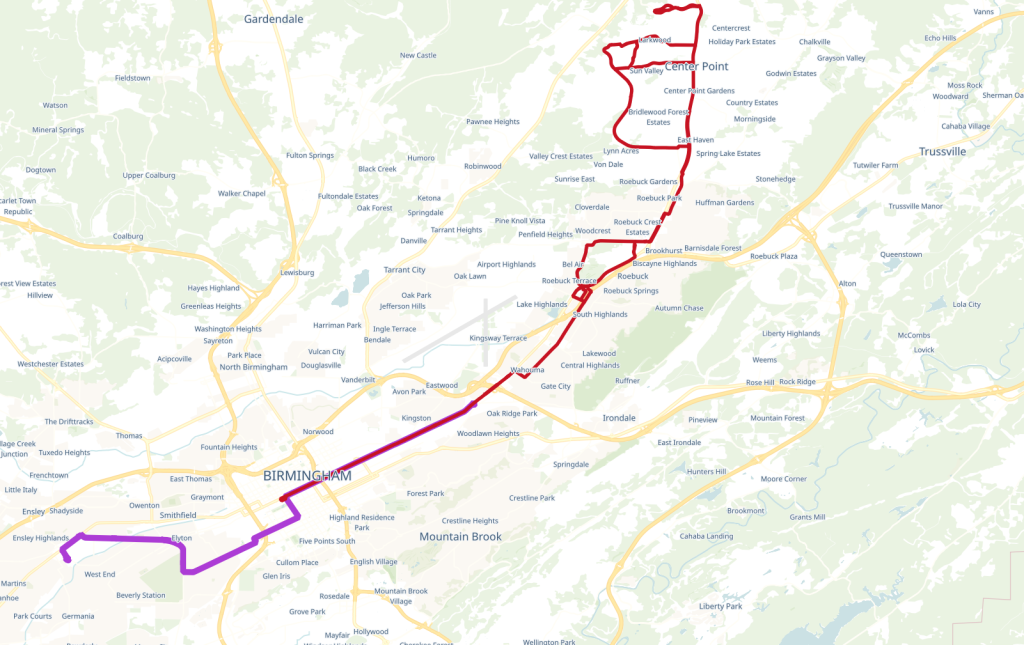
With the re-alignment, the Route 25 will still meet the BRT at the east Woodlawn Station, but will then follow the previous Route 17 down US 78 to Central Station.
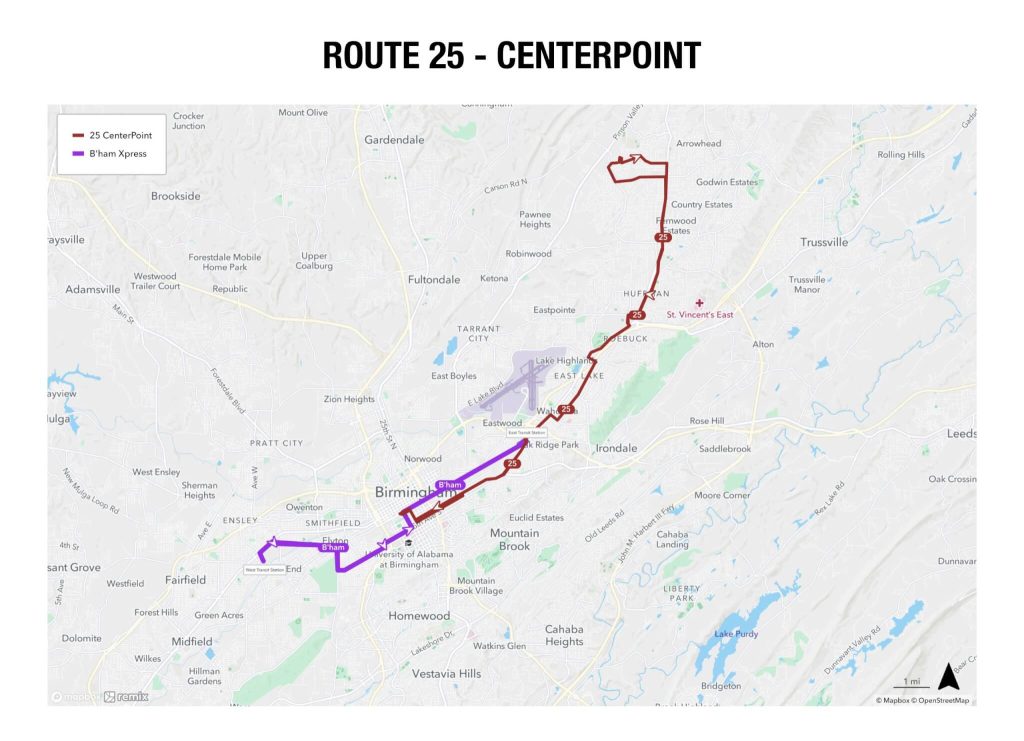
The Route 25 currently has two buses service it in the morning and evening with 45 minute frequency, but only a single bus during midday with 1 hour and 30 minute frequency. According to the modified schedule, the Route 25 will now have 2 buses servicing it throughout the entire day, giving it a constant 45 minute frequency and 6 extra trips a day.
This is a good thing for Center Point residents, however, overall this is a loss for some of the current riders of the 17. Most notable, the 25 does NOT run on the weekends, which means any riders that previous used the 17 between Central Station and Woodlawn will no longer have Saturday Service.
Route 48 – South Powderly
Several years ago, during some major cuts, the Route 8 was eliminated and the Route 48 was realigned to combine the 8 and 48. Frequency was also cut back. This is a map of the current Route 48 (Red) and BRT (Purple).
As you can see, there is quite a bit of overlap between downtown Central Station and the BRT. With the re-alignment, the 48 will no longer go to Central Station, and instead will use the 6th Av S / Goldwire BRT station has a hub. The rest of the route will remain the same.
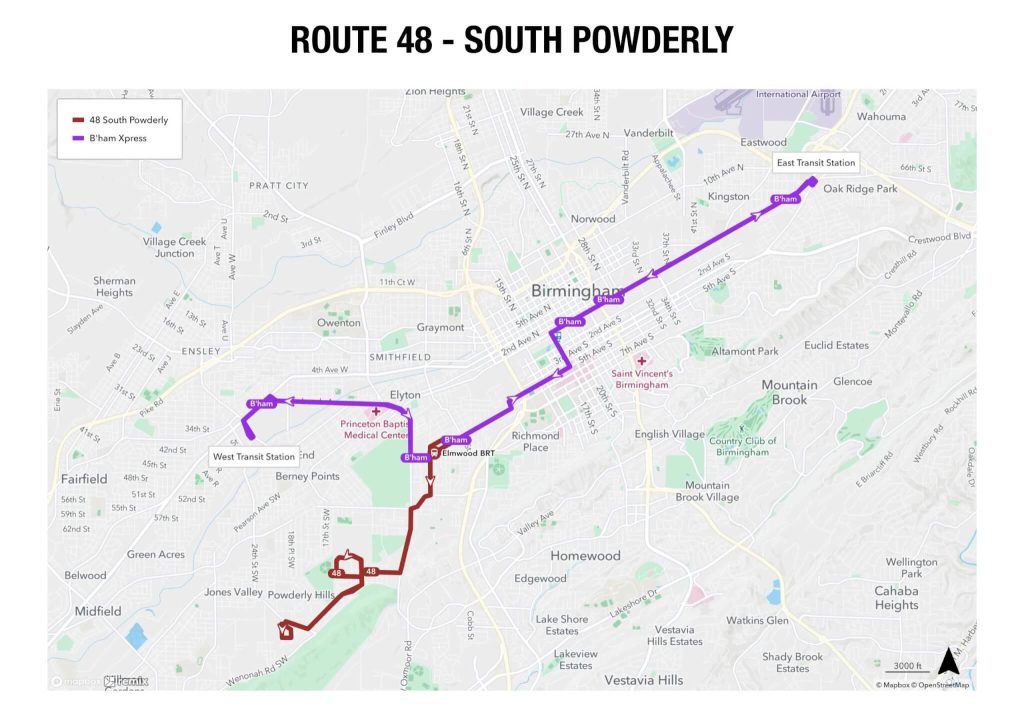
According to the proposed timetable, the Route 48 will now have a frequency of 1 hour, instead of 1 hour 25 minutes.
Route 7 – Fairfield
This is a new route that utilizes the BRT’s West Crossplex Transit Station as a hub and services Fairfield and connects with the Route 5 – Ensley/Wylam/Fairfield.
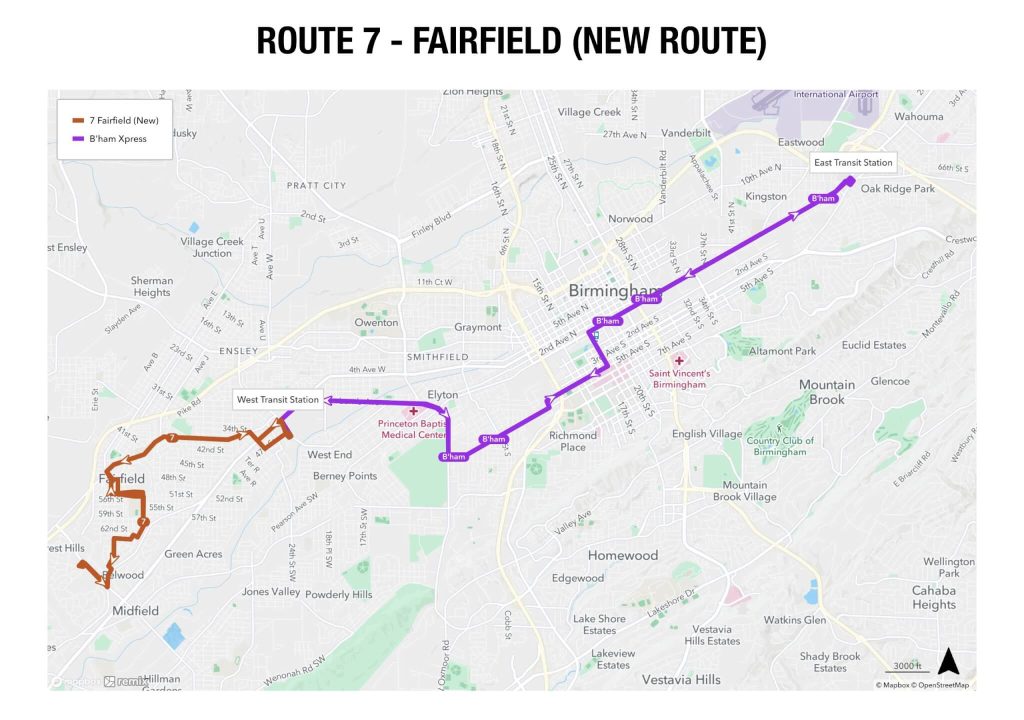
At this point, the route is somewhat limited, as it only runs on weekdays with a frequency of 1 hour. It also only runs in the morning (6am – 9am) and in the afternoons (3.30pm-6.30pm). The route also has a 10 minute buffer at the Crossplex Transit Station to help with connections to the BRT.
On Demand Changes / Route Eliminations
For those not familiar, the city of Birmingham entered a partnership with Via several years ago to provide On Demand micro transit. This allows riders to use an App similar to Uber/Lyft to schedule a pickup. A 5 person van picks up riders along the same route and drops them off.
However, this is not a door to door private service like Uber/Lyft. You are typically asked to walk around 1-2 blocks to a specific corner/side of the street. This is to help optimize the route, so the vehicle isn’t pulling U-turns or changing directions. It is possible that you will get the van to yourself, but if there are other requests along the same path, those riders may be picked up or dropped off along the way.
Originally, this was paid for and managed by the City of Birmingham. Recently, the city of Birmingham has been working in partnership with Max Transit to promote the service as a unified solution to transit. This is a step in the right direction, but eventually, Max Transit should be the owner of this rather than the city of Birmingham.
With constant budget cuts comes more route eliminations. The changes presented eliminate Route 12 – Highland Park, Route 18 – Fountain Heights, and Route 43 – Birmingham Zoo.
Route 12, Route 18, and Route 43 will all be eliminated!
These neighborhoods will no longer be services by _any_ fixed route bus service. Instead, Max is proposing extending the zone of the Birmingham On-Demand Service to include these areas.
In my opinion, this is a huge loss for these neighborhoods. Highland Park is the original street car neighborhood in Birmingham, and was designed around the #12 street car. Several years ago, when there were major route cuts due to funding, Highland Park lost the #44 and was left with only the #12. The #12 was re-routed to attempt to cover parts of both the #12 and #44, but instead, it ended up ruining the route costing ridership.
While I am not against On Demand Micro Transit, I have concerns about how it is currently being implemented. Micro Transit is not a replacement for fixed route service. Nor should Micro Transit be a way to bypass fixed route service.
If you look at many of the fixed route bus lines, you can see that they are rarely straight. Instead, they meander all over the place to pickup a few riders here or service this business over there. When there are budget cuts, routes get combined causing them to cover even more areas.
What this does is slow down the bus routes and leave us with long run times and poor frequency, making a frustrating experience. What should be a 15 minute bus ride, becomes 35 minutes due to it not being direct.
Micro Transit can help with this problem. It allows the transit agency to realign and straighten the route. The bus route no longer has to go out of its way, into a low density neighborhood, to possibly pick up 1 or 2 passengers. On Demand Micro-Transit can instead, pick up those 1 or 2 passengers and bring them to the bus stop. It solves a critical first-mile/last-mile issue, especially for those who can’t or won’t walk longer distances or ride a bicycle.
This can give everyone a better experience. The bus is quicker. The bus has better frequency. And most importantly, we don’t leave any riders behind.
Unfortunately, this is not how Birmingham’s On-Demand Micro Transit is currently being implemented. Even though it is now a “partnership” with Max, it is still a separate service, with a separate fare, and no ability to transfer between fixed route services or on-demand.
Using it as a replacement or an excuse to replace fixed route service is not a good solution. I really hope in the future, the implementation of micro transit is changed to require either the pick up location or destination be a transit station, and I sincerely hope Max considers bringing back fixed route service in both Highland Park and Fountain Heights.
Questions Left Unanswered
The public meeting about these changes left several questions unanswered. If I learn any more details about these questions, I will update this page.
Payment Systems + Transfers?
The Fixed Route Buses, the BRT, and On Demand all have different payment/fare systems and are not compatible with each other. This brings up a major issue for riders of the 17, 7, and 48, as they are now expected to transfer from fixed route to the BRT.
However, at this time, it is not possible to use your Fixed Route Fare which could be a single ride ticket, daily ticket, or monthly ticket on the BRT. You have to purchase a separate BRT fare card. This means that a trip from Eastwood to downtown now essentially costs $3.00 instead of $1.50!
Max leadership indicated that they are currently looking into unifying the system between Fixed Route and the BRT, but it is not clear if will be available by Mid May when these changes take effect.
Because the On Demand Micro Transit is paid for by City of Birmingham instead of Max and is operated by Via, there are no plans currently to integrate fares or transfers between it and the Fixed Route or BRT systems.
Updated On Demand Coverage Areas?
Currently, the On Demand service has limited coverage areas and does not currently include Highland Park. It stops just short at St. Vincent’s Hospital.
Max Leadership indicated that the On Demand coverage area would be expanded to include Highland Park, but there has been no confirmation of this at this time.
The material says “Via Daytime zone covers a good percentage of this local fixed route”. However, that is not true, as it only covers from St. Vincent’s Hospital to downtown, nothing in the actual Highland Park neighborhood. The online map still shows coverage of Highland Park lacking:
With the changes to the 17, many people between South Side and Woodlawn will now have to utilize the 25. However, the 25 doesn’t run on Saturday. Unfortunately, it does not appear that On Demand coverage will be expanded for this area either, leaving all these residents without any weekend service.
On Demand Hours?
Currently, On Demand doesn’t begin until 6am. Both the 12 and the 18 began service at 5.30am. Some riders were concerned they would no longer be able to make their connections at Central Station.
No Rider Left Behind?
Leadership did take each riders concerns very seriously and are looking to make this transition as easy as possible. To that extent, they are running a few month program during the transition called “No Rider Left Behind”. Any users affected by these route changes will be able to call a support number and have a van pick them up.
For additional information about these changes, please see Max Transit’s Web Site.