Announcing Realtime Bus Tracking for Smashing Dashboard

I recently set up a raspberry pi to use as a smart dashboard on my TV. The goal is to turn on my TV and have weather, my calendar, todo list, and other useful widgets readily available. Instead of building my own, I decided to use the Smashing Dashboard, a fork of the original Dashing developed by Shopify. It is a nice looking, simple dashboard and can easily be extended with lots of widgets.

One widget that I really needed is the ability to see when the next bus arrives at the stop down the street from me. Birmingham, Alabama’s bus system uses Availtec, which has an API for getting the real time location of the bus along with the estimated arrival times at a stop. Using this, I wrote a new widget for smashing called smashing-availtec. It should work with any transit system powered by Availtec. Here is what it looks like:

Real time bus tracking with Smashing Dash Board

Since there are multiple stops I want to monitor, my widget allows creating multiple widgets, and having each widget filter for a specific stop and route (in case multiple routes go through the same stop). It will give an estimated time of arrival for the next two buses and will also how a live map of where the next bus is.

Instructions for getting the source code and configuring it are available on my github project page. Enjoy!

Bus Wayfinding Maps

As an update to a project I was working on last year, I have been updating and redesigning some wayfinding signs. These signs are created to fulfill several purposes:

(1) Provide awareness about the bus system, (2) give bus riders and potential bus riders easy information about their options at their current location, (3) and to provide pedestrians with orientation and landmark information

Since each wayfinding sign is specific to its location, I have been choosing sites that specifically have a lot of pedestrian access and potential choice bus riders. So far I have created wayfinding signs for areas in Highland Park for the route #12 and #44, and also in Avondale for the #17. Here’s an example:

Route 44 in Highland Park
« of 3 »


I have been using all open source software to create these. All the routes and maps have been created using QGIS. Inkscape is used for creating vector designs, and Scribus for the final page layout and designs.

I have included all source material in the following downloads. If you would like to add additional locations our new routes, I would welcome any contributions.

If you would like to help hang signs on bus stops, Birmingham has over 3,000. I have found that laminating the signs keeps them protected from weather and that they can easily be hung with simple mounting brackets and industrial zip ties.

Downloads

Route 12

Route 17

Route 44


BJCTA Transit Maps

Code For Birmingham has been working towards making transit it Birmingham, AL more accessible. Part of this has been a push on how we can make transit easier for first time riders. A lot of our focus is centered around using technology, from real time tracking to buying bus passes directly on your phone. But we need to not forget the most basic thing every rider looks at: timetables and maps!


Several graphic designers along with GIS experts from Code For Birmingham, have been coming of with some mock-ups of both new maps and new timetable fliers.

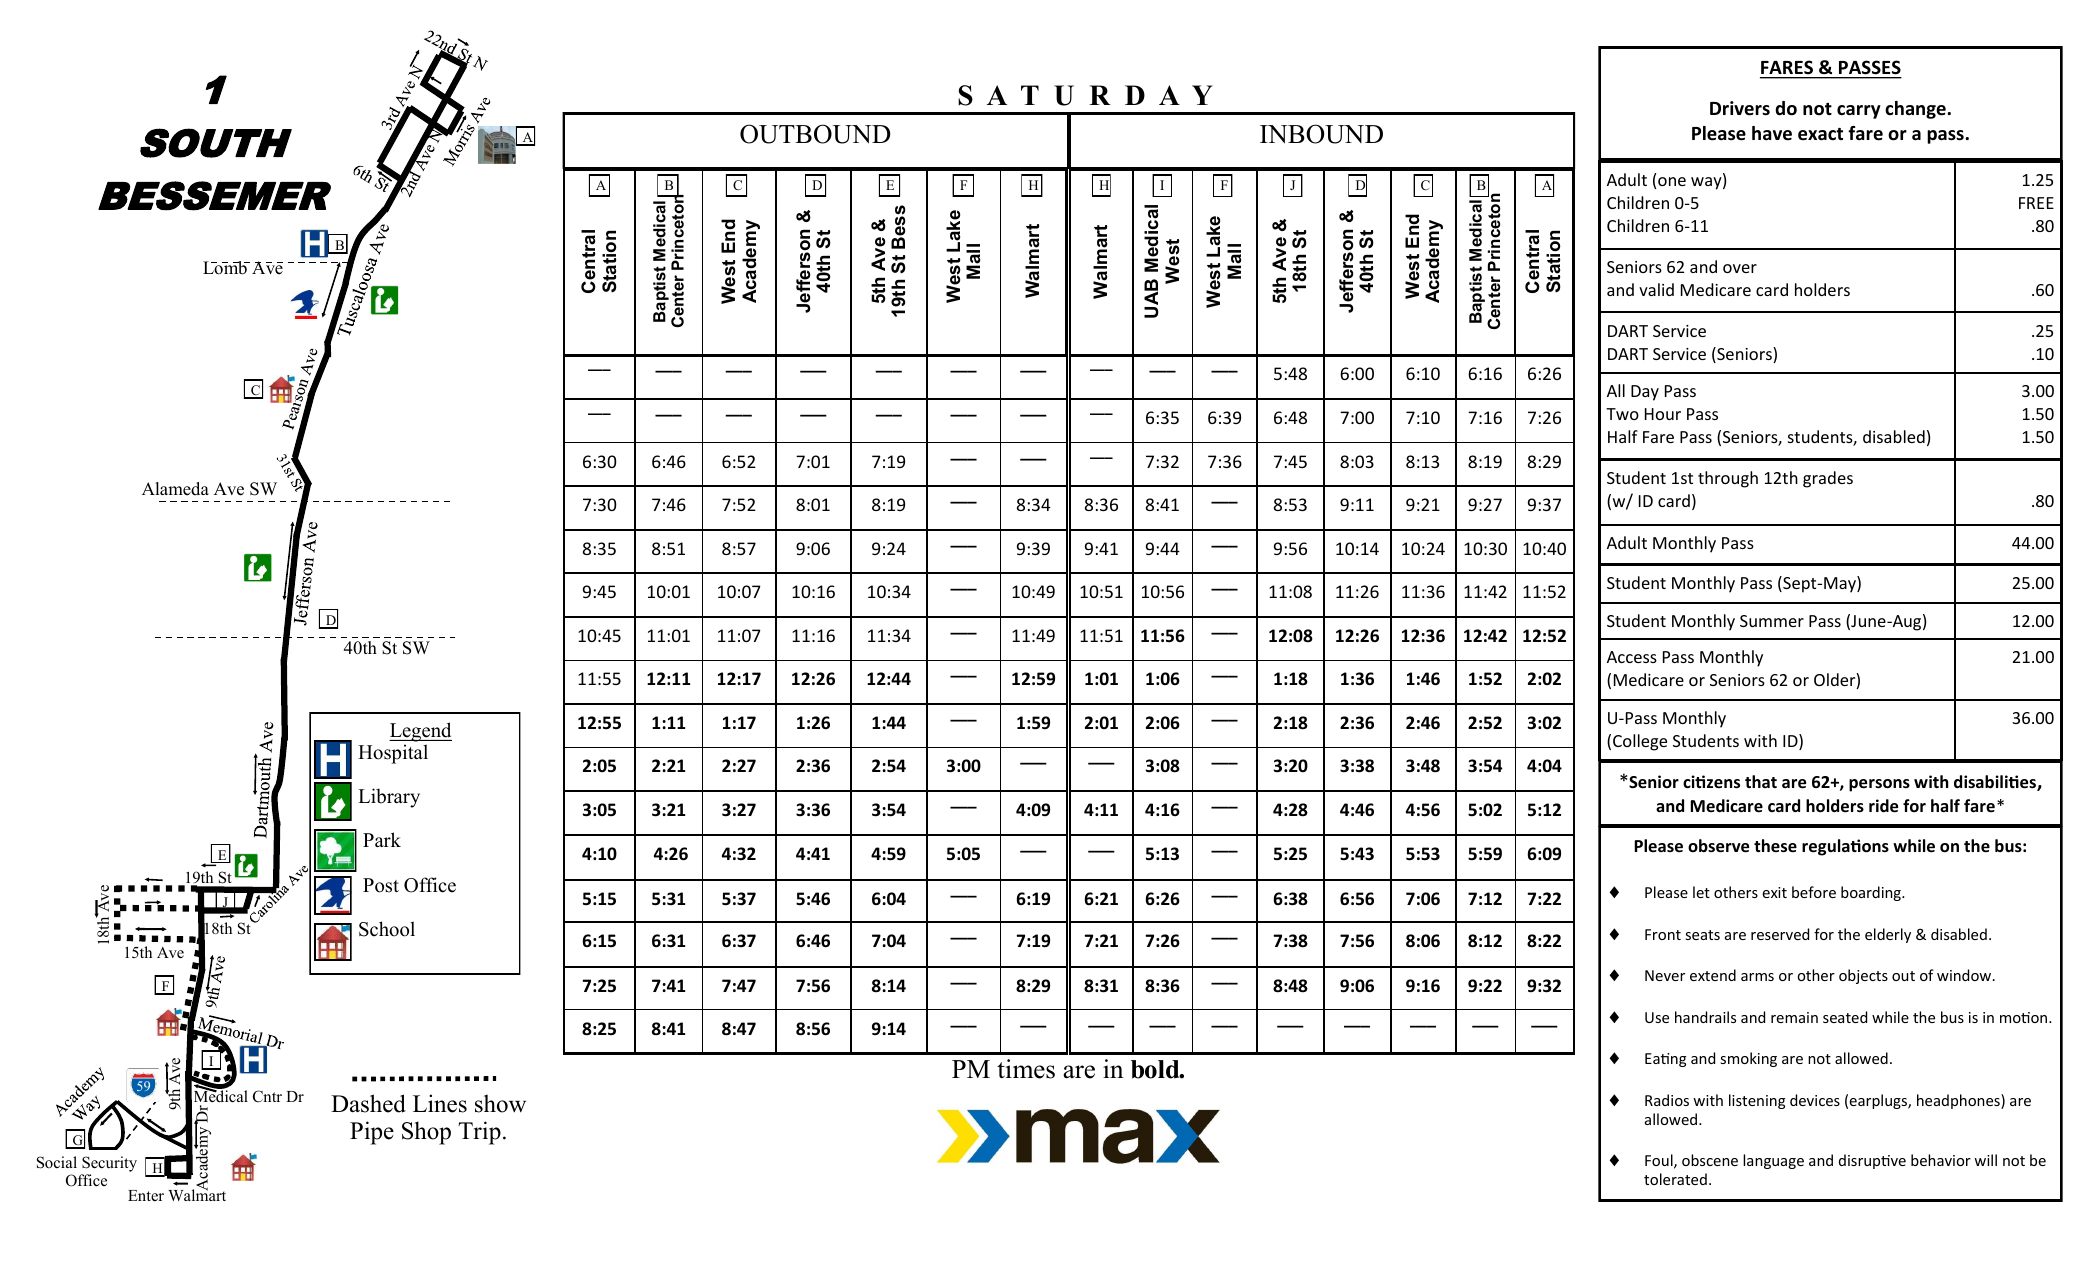
This is the existing timetable for the #1 route to Bessemer. I have found this to be cluttered and difficult to read.

1-SO-Bessemer-1

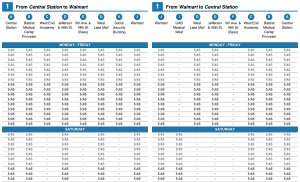
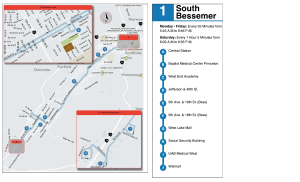
Below is our version of the #1 timetable. The data is the same (this is a mock-up so times weren’t filled in), but we’ve tried to make it easier to read. The locations are clearer and show up directly on the map, as you’ll see below. Instead of using words like Inbound and Outgoing, we are more focused on the starting points and destinations.

route1-timetable

And this is the existing map for the #1 route to Bessemer. Even as someone who is very familiar with this area, I find this map very difficult to read. It is missing all points of reference, distances aren’t accurate, and it isn’t clear that North is not pointing up.

1-SO-Bessemer-2

This is our version of the map. We’ve overlayed the route directly on top of a street map, so areas of the city are much more clear. We also have insets to highlight the important detailed areas, like downtown Birmingham and downtown Bessemer. Location points are clearly labeled and correspond with the time points in the time table. We also have the large “subway style” stop map on the right, with times when the bus runs, frequency, and key stops, so that a user can quickly glance at it and have a basic understanding of the bus route.

route1-map

These time tables and maps above are meant to be fliers given out about the route. But Birmingham is finally in the process of removing a city ordinance that banned any information from being displayed at bus stops (I know crazy, right?). With this ordinance being removed, the BJCTA will finally be able to post route maps and information at stops and shelters. With this in mind, Code for Birmingham starting looking at what information would be useful.


While in Paris earlier this year, I noticed the maps they had at their bus stops. An example of the 69 line is shown below.

photo

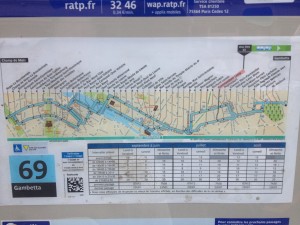
I found these maps very useful. I tend to be someone who walks in random directions in a city, so I often find myself slightly lost. So when I came to a bus stop that had this map, I was immediately able to tell where I was in the city, what my orientation was, what was nearby, and most importantly, what transit options I had at this location. I was without data on my phone, so it was interesting to get around by bus without having a smart phone to immediately look routes up or get real time trip planning. If I didn’t plan out a route before I left, I would have been pretty lost. But I found I was able to look at any one of these maps and immediately understand the route and availability.


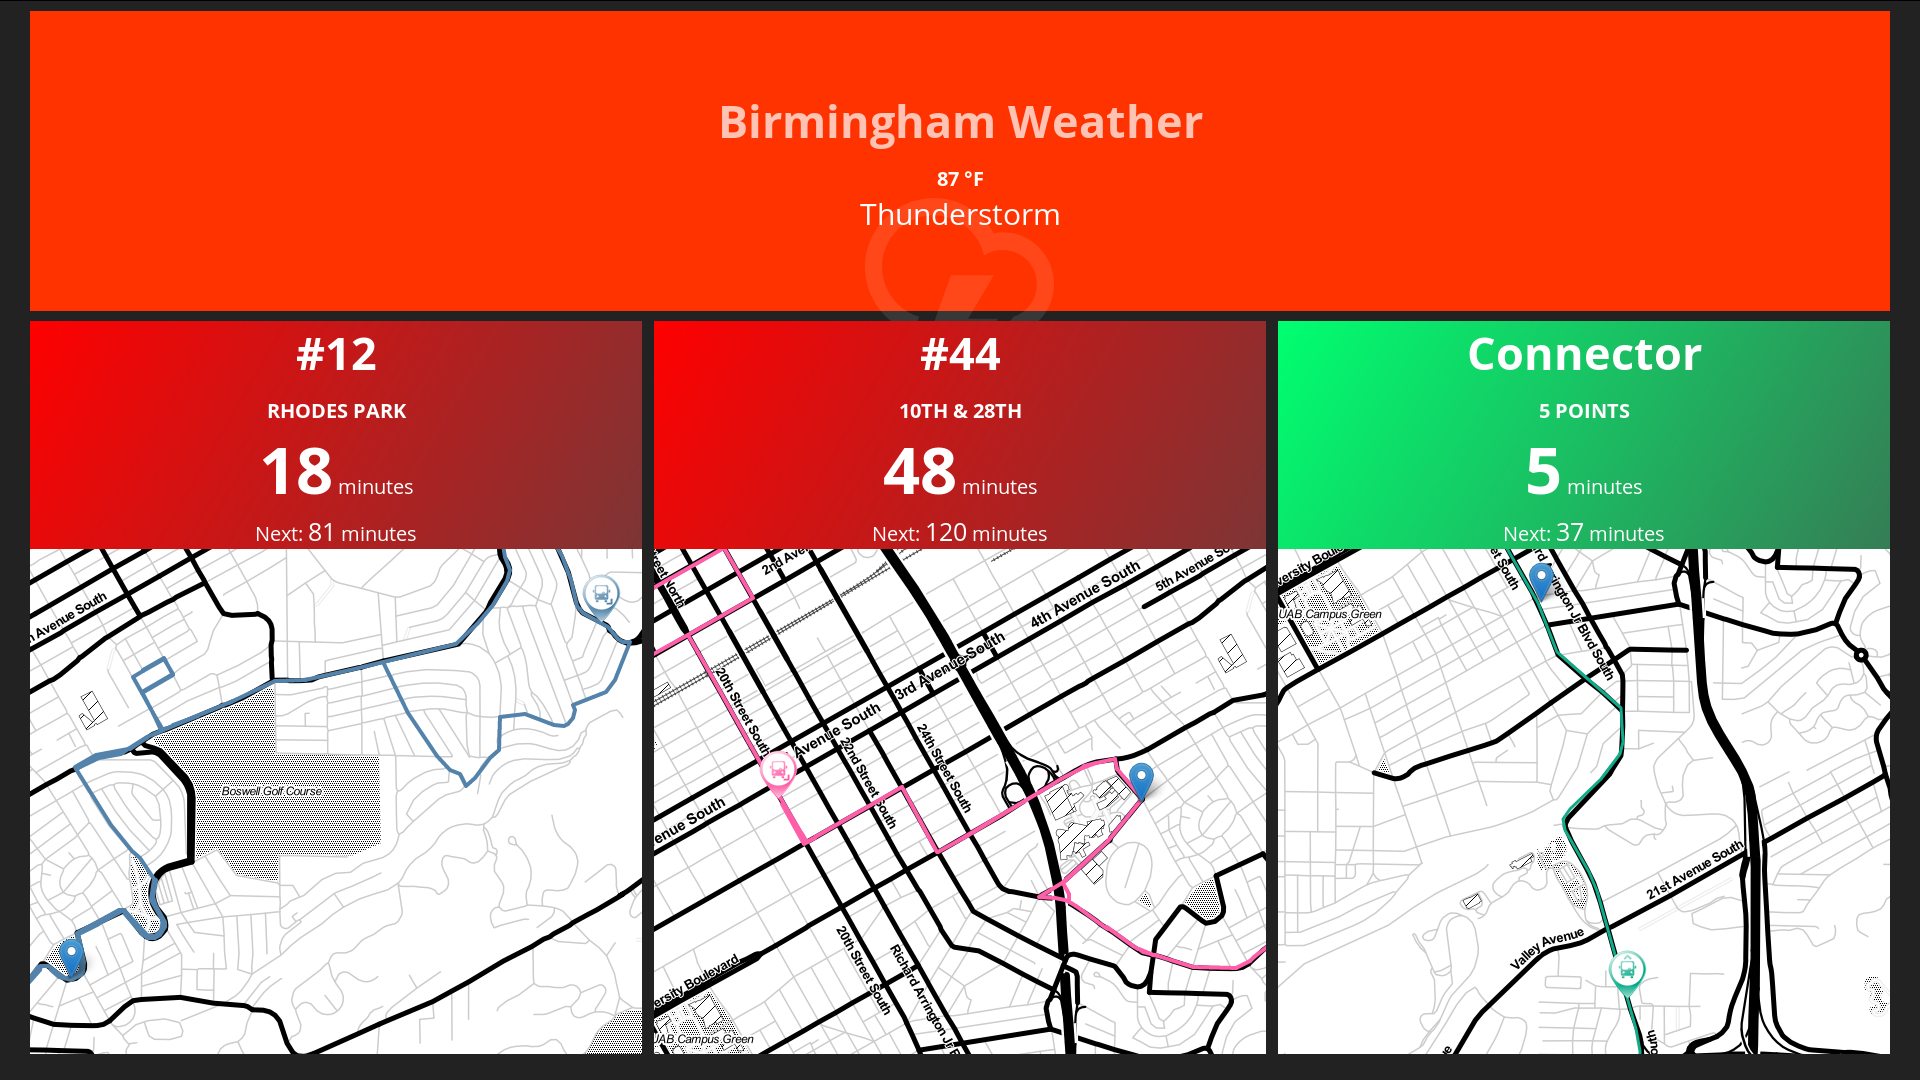
So based on this, I have recreated a short route in Birmingham, the #12. I am not a graphic designer, so I know this could use a lot of work, but I want to just focus on the concept for a minute.

Route12_StopsMap

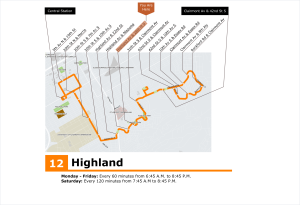
I am hoping we will be able to create versions of this for every route, at every stop. Not only will this be useful for existing riders, but I think pedestrians will use them for wayfinding. It will help advertise and market the system, and hopefully, a potential bus rider will see how easy the system is, and use public transit.

Initial Bus Transit Directions

Continuing on with my project to get Birmingham’s MAX bus system on Google Transit, I was able to get the Open Trip Planner software up and running. This is letting me visualize some of the preliminary GTFS data to validate it before I continue work on the rest of the routes.  Here’s two examples showing trip planning between various locations. The stop locations are coming from my stop cataloging site.


Riding from Downtown to the west side on Bus #8
Riding from Highland Park to South side on bus #12

Birmingham Neighborhoods on Click that ‘hood

Click that ‘hood is a fun site developed by Code for America where you test your knowledge of the neighborhoods in your city. Being an activist for Birmingham, along with my fondness of maps, I decided I would get Birmingham up on their site. After all, they just need some GIS data formatted properly. No problem, I’ve worked with GIS data plenty of times before!

Unfortunately when it comes to GIS data, neighborhood boundaries are difficult to come by. This is probably because neighborhood boundaries are fluid and aren’t completely defined like political boundaries. The most popular site for neighborhood boundaries, Zillow.com, didn’t have any available for Birmingham. I kept searching and came upon Birmingham’s Map Portal. This site has some great data on it, including all the neighborhoods. It was just what I was looking for, except, you can’t actually export any GIS data off of it. You can only view it and take screen shots. (It sounds like it’s time to get an open GIS site running for Birmingham… maybe my next project?)

I had images of the neighborhood data now, but this meant I still had to draw the vector data to overlay on a map. Using QGIS, openstreetmaps, and finally Google Maps, I traced out each of the neighborhood boundaries as vector data. I have it available in both KML and GeoJSON formats:

You can also view my Google Map of the neighborhoods.

With that, I was able to upload the data to Click that ‘hood. So, go play and see how well you know Birmingham’s neighborhoods!