I have been making several improvements to the montclair code base, which is the software that powers all the Go Transit apps.
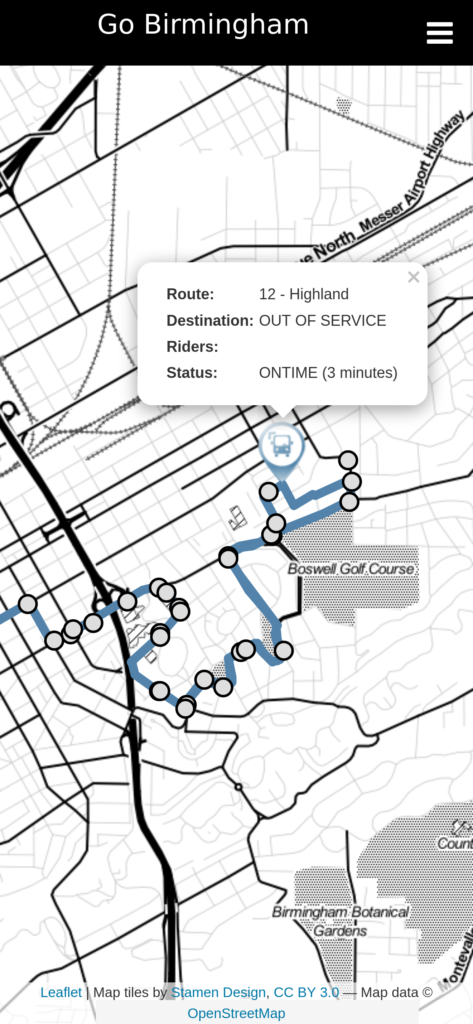
See the stops for the Highland #12
First, for the selected routes, you can now see where all the stops are. This helps people who are unfamiliar with the system know where to pick up a bus that is near by.
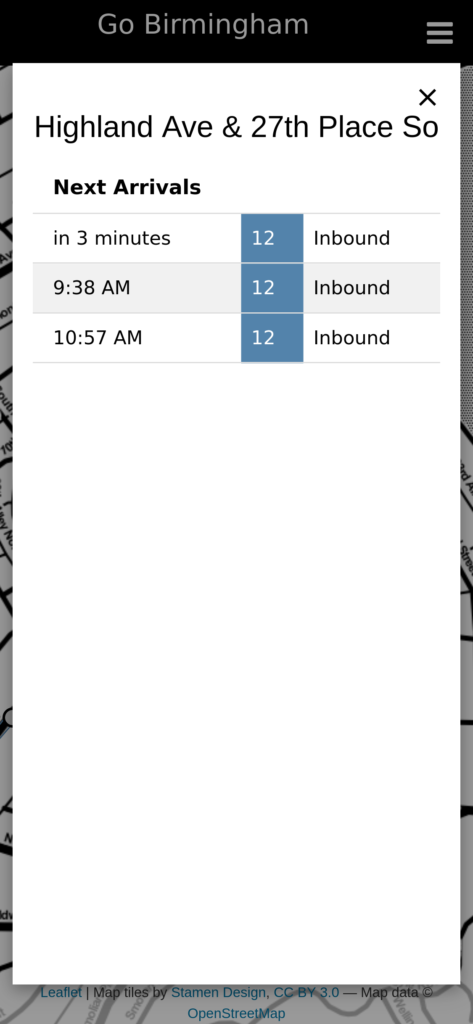
Stop Arrival Times
Selecting a stop on the map will show you the estimated arrival time of buses for that stop! This is a live view that is continuously updated as the arrival estimates change.
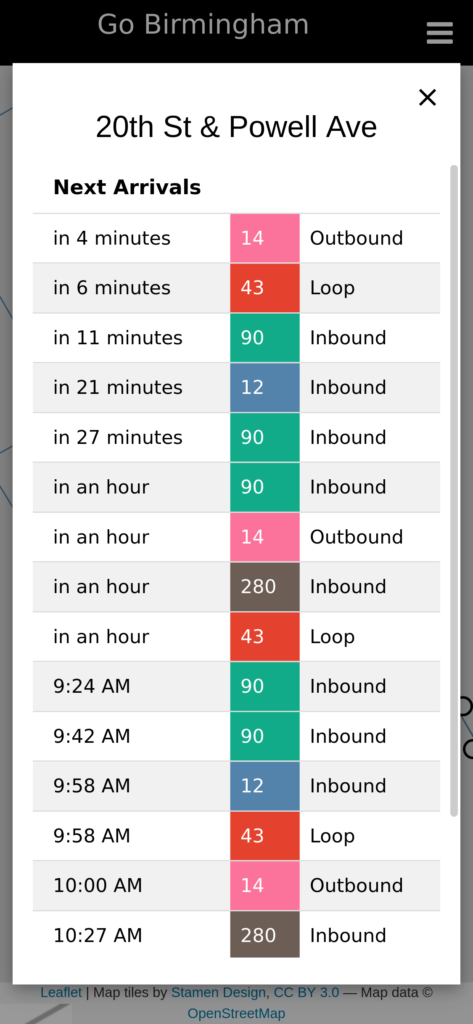
Arrival Times of a Stop with Multiple Buses
If multiple buses go through the same stop, then the app will show the arrival estimates for all the buses. This is especially useful in cases where routes overlap and you have multiple options.
All of these changes have already been pushed out, and any apps you have should automatically update!
During a recent visit to Steamboat Springs, Colorado, I quickly became frustrated with the app for the free bus system. I thought to myself that it would be really nice to have my Montclair app available for other cities. With that, the Go Transit series of apps were born.
I started off building out github actions for the montclair, montclair-pwa-android, and montclair-pwa-ios projects. The github actions will automatically generate a compiled build when the repository is tagged.
The next step was to build a transmogrifier. The transmogrifier takes a configuration, then pulls down a specific version of montclair, montclair-pwa-android, and montclair-pwa-ios, and replaces all the necessary names, strings, icons, and other information. The new versions are then pushed to their own repositories and tagged, which automatically kicks off the white labeled builds.
All that is left it to create a custom configuration (see Steamboat for an example). The assets projects all have github actions too, and each time a commit is pushed, it will then run the transmogrifier.
When all the builds are done, they can be uploaded to my website hosting provider, the Google Play Store, and the Apple App Store.
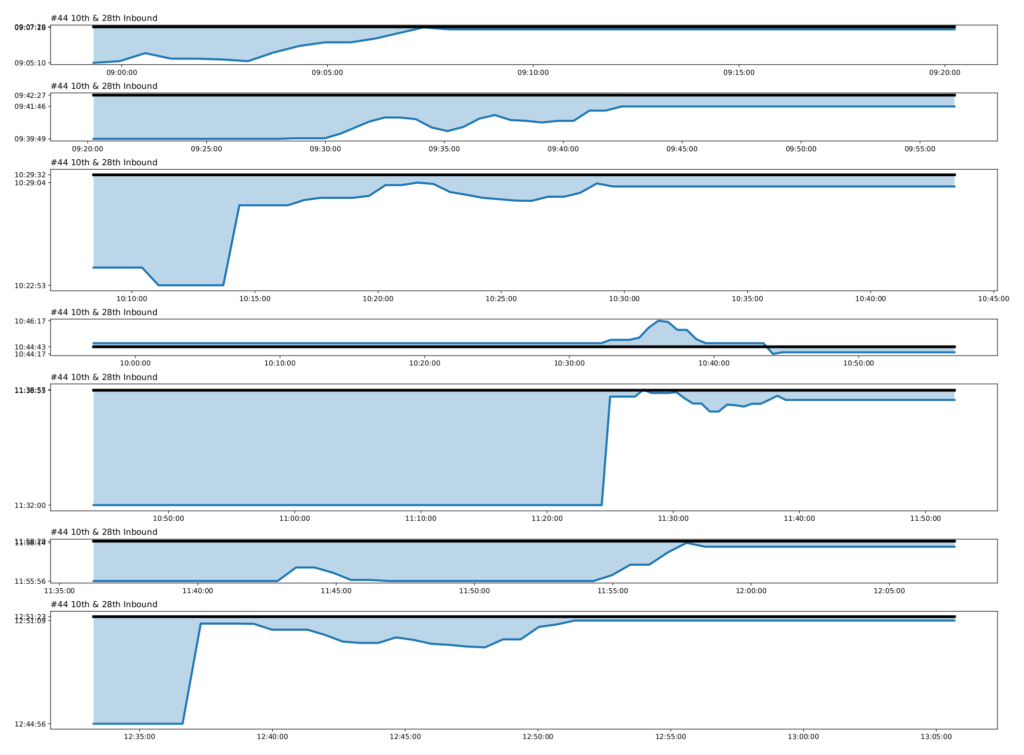
In my last post, I created a dashboard that shows the estimated arrival time of buses at specific stops. After using it, I was curious to see how accurate those estimates are.
Each “block” is a bus trip throughout the day. The dark black line represents the actual time the bus arrived at this stop. The dark blue line shows when Availtec estimated the bus would arrive at that specific time.
Ideally, the dark blue line would be as close as possible to the dark black line.
From the image above, we can see that the 4th trip, from 10:44:17 to 10:46:17 had the best estimate. From 10:00am to 10:50am, Availtec estimated the bus would arrive ±30 seconds from when it actually did.
We can also see that the trip after it, had the worst estimate. From the time the trip started, just before 10:50, until around 11:20, Availtec was estimating the bus would arrive at 11:32, when it actually came at 11:38. It wasn’t until about 11:25, that the system suddenly corrected and started estimating a more realistic time.
This project works with any bus system that utilizes Availtec for real time tracking. You can leave the capturer program running in the background for days, then generate graphs based on that historical data. The graphing script allows you to specify which stops, routes, and days to plot.
I recently set up a raspberry pi to use as a smart dashboard on my TV. The goal is to turn on my TV and have weather, my calendar, todo list, and other useful widgets readily available. Instead of building my own, I decided to use the Smashing Dashboard, a fork of the original Dashing developed by Shopify. It is a nice looking, simple dashboard and can easily be extended with lots of widgets.
One widget that I really needed is the ability to see when the next bus arrives at the stop down the street from me. Birmingham, Alabama’s bus system uses Availtec, which has an API for getting the real time location of the bus along with the estimated arrival times at a stop. Using this, I wrote a new widget for smashing called smashing-availtec. It should work with any transit system powered by Availtec. Here is what it looks like:
Real time bus tracking with Smashing Dash Board
Since there are multiple stops I want to monitor, my widget allows creating multiple widgets, and having each widget filter for a specific stop and route (in case multiple routes go through the same stop). It will give an estimated time of arrival for the next two buses and will also how a live map of where the next bus is.
Instructions for getting the source code and configuring it are available on my github project page. Enjoy!
This came about because I have been unhappy about how iOS handles progressive web apps. Every time the app is brought to the foreground, iOS does a full reload, which can be slow and annoying. The native app handles this much nicer, and doesn’t ever have to reload the state.
To build the native apps, I used this handy tool: Progress Web App Builder. It takes your website, wraps it using Cordova, and generates both an iOS and an Android project. With only a few tweaks, I was able to get them submitted to the app store.
Birmingham, Alabama’s transit agency, the BJCTA (Birmingham-Jefferson County Transit Authority) has a website for tracking the buses in real time. This website along with their mobile app are ok, but have some things that constantly annoy me. My biggest annoyance is that every time the App is brought to the foreground, it refreshes and resets you back to the main page, losing the bus you were trying to track. The other problem is that you can only view one route at a time (at least on the mobile app). I have 3 routes that I can choose between every day. When I open the app, I want those three routes selected by default so I can quickly see which route to pick.
With the recent arrival of gnome 3.28, and with it, the Epiphany Web browser 3.28, saving a web page as a webapp has dramatically improved. Saving a page as a webapp has several advantages:
Cookies are separate for each app. This helps limit tracking, but can also make managing multiple accounts much easier, like separating out your person gmail account with a work gmail account.
A clear separation of tasks. I spend a lot of time in Jira, confluence, and the AWS console. Keeping them as separate applications instead of digging through 50 tabs in firefox, is very useful.
They are treated as completely separate apps. This means that they have their own launcher with their own applications, can be pinned to the dock, and show up as separate applications in the window switcher
Each web app shows up separately in the alt-tab window switcher
Each Web App shows up as a separated application that can be pinned in the dock on the left.
Creating a web app in Epiphany is as simple as browsing to the website you want, clicking on the Menu button (三), and choose ‘Install Site as Web Application…’
Deep Links
iOS and Android support the concept of Deep Linking, also sometimes known as Universal Links. The idea, is that if you click on a link for a specific website, say Reddit, the operating system can decide to open that link with the installed Reddit App instead of the web browser.
I have found this to be a nice concept. When I get an email or slack message with a link to a Jira ticket, I want it to open up with my Jira web app, not my default web browser. After all, that was part of the point of having created these separate Web Apps. Unfortunately, there is no native support for this feature, but, since Linux is an open and configurable system, there is always a way!
Creating a new Default Web Browser
Gnome only allows registering applications based on the MIMEType. Unfortunately, all websites share the same scheme: ‘x-scheme-handler/http’. By default, gnome opens up your default browser and passes it the URL. We will create a new simple shell script and make it our default web browser. This simple shell script can do some basic parsing of URLs, then decide to open up a specific web app or to pass everything on to firefox.
A .desktop file is required to register our new App. Create a new file called:
This declares that it can handle the necessary MimeTypes for URLs. You will also notice that it executes /home/username/.local/bin/http-handler. This is the script we are going to create next, however, please change the username to be your username.
Building the Web App Script
I am just using a simple bash script to parse the URL and decide whether to open a specific web app or to open the default web browser. You can modify this or write it in any language that you want. This is just mean to be a simple example.
Create a new file named `~/.local/bin/http-handler` with the following:
My script looks to see if a URL matches my Jira url, and if so, opens that webapp. Otherwise, it checks to see if it matches AWS console, and opens my AWS webapp. Otherwise, it runs firefox and opens the URL in a new window.
While there are many ways to parse the URL, this one uses gawk so we can test some regular expressions. The Jira URL was interesting because I want everything that starts with https://company.atlassian.net/* except https://company.atlassian.net/wiki/* since that is confluence, a separate app.
One thing about Epiphany Web Apps, is that there isn’t an easy way to run them directly. They must be executed through their .desktop file. This is so that they set the correct WM class so that the desktop environment knows to treat them as a separate application. Fortunately, we can use the gtk-launch program which takes a .desktop file (minus the .desktop) as a parameter, and launches it.
Fixing the .desktop files
When you install a Web App, epiphany creates a new desktop file in `~/.local/share/applications/` with a name like `epiphany-website-a8d40c5d8d04433783264b93849886b867fa11c4.desktop`. These desktop files have the website hard coded into the Exec line. This means that we can’t pass it a URL, so it always opens up to the default page, which isn’t what we want. I haven’t yet found a way to have a default parameter that can be overridden. The trick is to create a copy of the .desktop file that does take a URL as a parameter. This means we will end up with two launchers, but we’ll set the NoDisplay parameter in our new one, so that it doesn’t show up in the launcher screen.
Copy the webapp .desktop file to a new name, something like:
Edit your new `eiphany-jira-url.desktop` file. We are going to change the Exec line to take a URL parameter, and we are going to set the NoDisplay=true:
to make sure it opens your web app. And, you can test the fallback to your web browser by running:
~/.local/bin/http-handler https://google.com
Set your Default Web Browser
With our script now working, the last step is to make our http-handler program the default web browser. This can be done on the command line by running:
xdg-settings set default-web-browser http-handler.desktop
If that doesn’t work, open up the gnome settings, go to Details -> Default Applications and make sure Web is set to ‘HTTP Handler’.
You can now test from the command line by running:
My previous blog post (Visualizing the On Time Performance of Birmingham’s Bus System) looked at creating visualizations based on the real time data provided for Birmingham, Alabama’s public transit system. I have now created a simple, public API that can be used to query the historical data captured from the real time system.
Using my dv8Â scripts, I am capturing a snapshot of the real time data every 30 seconds. I am then storing this data in a sql database, so that we will have a historical database. This allows for generating reports and visualizations over time. As of writing this, I have about 2.5 months of data captured.
I am making all of this data public, along with a simple API for making queries. The API is located at:
https://api.dv8.line72.net/
However, if you visit that site, you will notice that you get a ‘Page Not Found’ error. That is because it is only a backend API, and you will need to construct URLS to make queries. Let’s look at a few sample queries (All data is returned in JSON format. I have found that making these queries in Firefox is preferred over Chrome, since Firefox will nicely format the results):
This returned a list of all the known routes and their properties. Each route also has a set of “Trips”. A trip is a unique instance of a bus running along a route. For example, if everyday at 4.00pm a bus leaves Central Station along the route 44 and arrives at its final destination at 5.00pm, this would be a Trip. We can get a list of all the trips for a specific route.
Query for all the trips on the Route 44
Based on the previous query, I have found that the “44 Montclair” has an id of 21.
This returned all 61 trips associated with the route 44. Unfortunately, this doesn’t give us that much information about the individual trip. For instance, we have no idea based on the returned results what time of day a trip runs. For every trip, we can get a series of “Waypoints”. Waypoints are all the known information about a bus on a trip at a given time. They are essentially a snapshot, showing the location, passenger count, time deviation, and various other details. We can pick a specific trip and query it.
Query all Waypoints for a single trip on the Route 44
I am going to select a trip at random from the previous query. I will use 699, and will query its waypoints:
This returned A LOT of data. This trip runs every weekday, and we have samples at every 30 seconds. The API returns a maximum of 1000 waypoints, so only the first part of the data was returned. Typically, we want to filter this data, and only get a specific range. For example, let’s only get the waypoints on a specific date. We can use the start_date and end_date parameters to put limits:
On this date, this trip was an Outbound (0) trip. It left Central Station at 11:45:00 AM and arrived at Eastwood Mall on time at 12:21:00 PM.
We have samples every 30 seconds of this trip. Using that, we could calculated the average on time performance or visualize the number of passengers on the bus. You can take this json data and convert it to CSV using a simple converter tool. You can then import your CSV into a spreadsheet program, like Excel or LibreOffice Calc and create visualizations.
A few months ago, Birmingham, Alabama’s bus system (BJCTA Max Transit) retrofitted all of their buses with a GPS system. Along with this upgrade, they released a website allowing riders and the public to track the locations of buses in real time. The website is backed with a public RESTful API, so I decided I would poll the API to retrieve live information on all the buses throughout the day and store them in a local database.
With this information, it is possible to run some analysis on the system. We could look at passenger count, travel time, travel deviation, areas where buses tend to slow down, performance at different times of the day, and a host of other analytics.
The first analysis I have done is looking at the time deviation. This is how far ahead or behind schedule a bus currently is. A negative number means it is ahead of schedule and a positive number means it is behind schedule. The general rule is that ± 5 minutes is “on time”.
The graph below goes through an entire day looking at all the buses on each route. Each route is separated into its own section, so you can clearly see how a single route performs throughout the day. Along a route, multiple buses will simultaneously be making individual trips along that route. Each color represents a different bus making a different trip. Since there is overlap between buses sometimes making it difficult to see where a trip starts and ends, I have placed bars below the graph. Each of these bars mirrors a single bus making a single trip, allowing you to easily see how many active buses there are and when they started and stopped their trip.
If we zoom into a specific route, we can get more detail (Click on the image to see the full day). This is line 17 – Eastwood Mall. It is one of the busier routes with several buses making simultaneous trips. As you can see, most trips start and end on time, however, there is a bit of a peak about halfway through the trips, where the bus is behind schedule by up to 15 minutes.
After looking through the data, I have few interesting conclusions:
There is quite a bit of deviation along most routes. However, the most important thing to look at is the start and end of each trip, and for most trips, those have a tendency to converge on 0 deviation. This means the overall trip length is as expected, but buses are being held up in the middle of trips due to traffic and other unforeseeable circumstances.
I don’t know what happened to the 14 (Idlewild Palisades) around 5pm. I’m thinking the bus broke down and a new bus (purple) had to be sent out to replace it.
Some routes are interlined. For example, the 12 and 18. The bus starts off as the 12, does its trip, but once it pulls into central station, that same bus becomes the 18 and does a trip along route 18. When it returns to central station, it once again becomes the 12. It appears as though the 18 is constantly taking longer than the expected time which makes the 12 start late. Even though the 12 makes up time, it can’t seem to ever get on schedule.
The 280 runs down a major suburban corridor that has the worst traffic in the region. Even during rush hour at 5.00pm, the route is expected to have the same trip time as 10am. Clearly it doesn’t.
The most heavily used routes: 17, 1, 3, 44, 45, 6, 28, 8, 1 Ex all have minor deviation and run on time.
I’m still cleaning up the code, but it is currently usable. I’m also thinking about porting this to D3 and doing live visualization on a website rather than generating a static image.